


 Current
location:
Sanitation verification is the part of a hygiene programme that proves cleaning happened and worked. It is also the part auditors examine most closely, because a plant can claim any cleaning regime it likes and only records show which one actually ran.
This article describes how to structure verification so that it is both useful to production and defensible in an audit. It is written by the engineering team at HENG MEI Intelligent Manufacturing for quality managers and sanitation supervisors.
Map points before choosing instruments
Verification starts with a drawing of the plant, not a purchase order. Mark on the layout every surface that contacts product, every surface that contacts product-contact surfaces, and every environmental location where moisture collects. Then assign each point a risk level based on how close it is to exposed product after the final microbial kill step.
| Zone | Definition | Verification intensity |
|---|---|---|
| High risk | Product contact surfaces downstream of the kill step | Every cleaning event, before start-up |
| Medium risk | Surfaces adjacent to exposed product, equipment frames | Daily or per shift |
| Low risk | Floors, drains, walls away from open product | Weekly, plus after any intervention |
| Utilities | CIP final rinse, process water | Per CIP cycle or monthly |
A plant with 300 mapped points does not swab 300 points a day. The routine uses a rotating subset that covers every point within a defined cycle, with high-risk points sampled every time. That is a schedule, and the schedule itself is a record an auditor will ask to see.
Choose the verification method per question
Three methods answer three different questions, and a robust programme uses at least two of them.
- Visual inspection — is soil visible. Necessary, cheap, and unable to detect residues that are invisible but present.
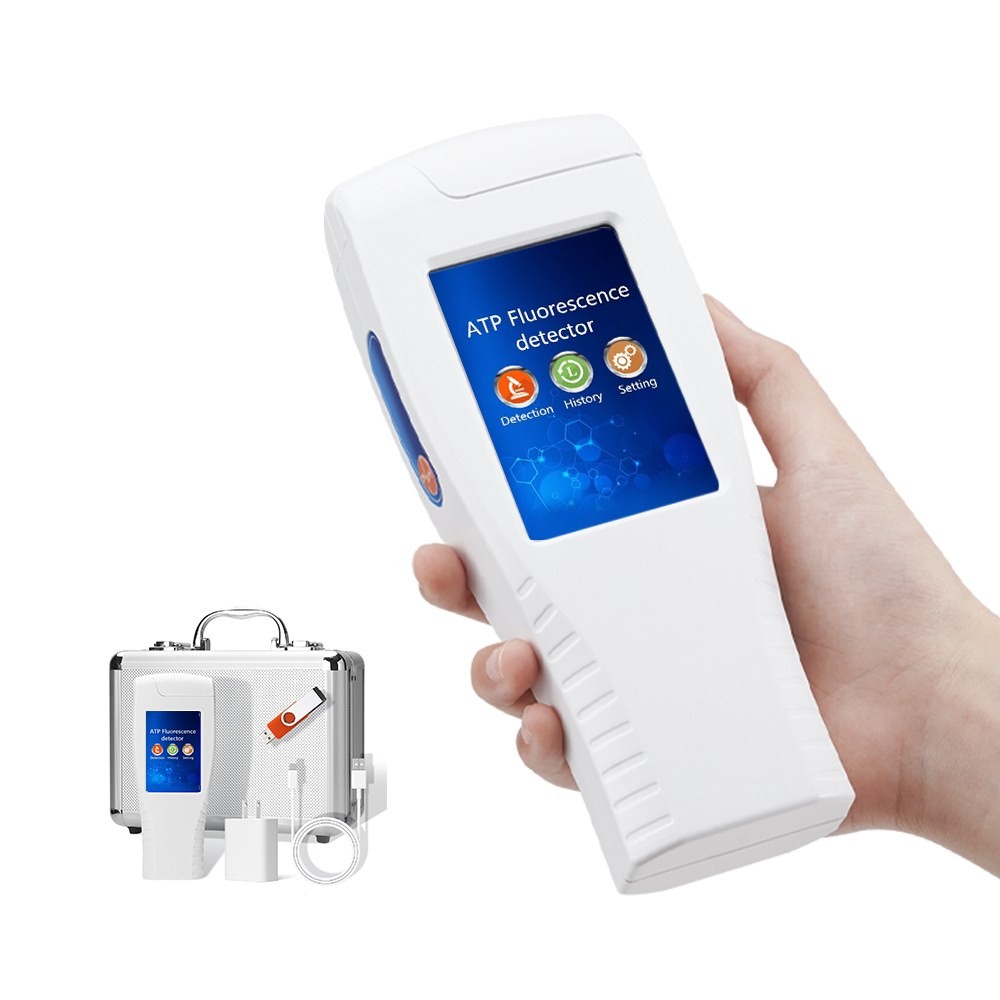
- ATP swabbing — is biological residue present, measured in seconds. Immediate, and therefore usable inside the cleaning window.
- Microbial swabbing — are viable organisms present on that surface. Slower, and the only method that answers the microbiological question.
Used together, they form a sequence: visual for immediate rework, ATP for release of the line to production, microbial for trend and for verification of the cleaning regime itself. Used alone, each has a blind spot that matters — visual misses residue, ATP cannot distinguish residue from organisms, and microbial results arrive too late to re-clean the same shift.
Set action bands, not a single limit
A single pass limit produces two outcomes, pass and fail, and no guidance on the borderline. Three bands produce an instruction.
| Band | Typical action | Record |
|---|---|---|
| Below pass limit | Release line to production | Value, point, time, operator |
| Between pass and fail | Re-clean the point, re-swab before release | Both values and the re-clean action |
| Above fail limit | Stop, investigate the cause, re-clean, verify | Investigation note and corrective action |
The fail band should trigger a cause question rather than a repeat clean. Repeated failures at the same point usually indicate a design defect — a rough weld, a dead end, a worn seal — and cleaning more aggressively does not fix a design.
Records that survive an audit
- Sampling point identity matching the plant map, not a free-text note.
- Timestamp from the instrument, so the order of cleaning and verification can be reconstructed.
- Operator name, because technique variation between operators is larger than instrument variation.
- Swab and reagent lot, for investigating a shift in readings across the plant.
- Action taken for anything outside the pass band, with the re-test value.
Instruments that store tens of thousands of records and upload over Wi-Fi make this routine; paper records make it a weekly administrative task that eventually stops being done. Where an audit is expected, the ability to export by point and by date is worth more than a slightly better sensitivity specification.
Frequency, realistically
Frequency should follow risk and history, not habit. A starting point that most plants can sustain: high-risk points every cleaning event, medium-risk daily, low-risk weekly, and a full-map sweep monthly. After three months, reduce frequency at points that have never failed and increase it at points that have failed twice.
That adjustment is itself evidence of a functioning programme. An auditor is more impressed by a schedule that changed in response to results than by one that has not been touched since it was written.
Where the instruments fit
The handheld ATP detector used in this routine is described in our ATP monitoring guide, including its 15-second test time, user-set limits and record capacity. Where the verification question is microbiological rather than residue-based, a reagent-bottle microbial system provides CFU results within a shift; the trade-offs are covered in the microbial detection guide.
To structure a verification programme, tell our sales contact the number of mapped points, the cleaning frequency per line, whether records must be uploaded to a customer or certification platform, and the microbial method used for periodic verification. Those four facts determine instrument choice and the record format.
Contact: Grace, Sales Contact, graceliu@hmdzkj.cn, +86 17853698681 (Tel / WhatsApp / WeChat).
Article address:https://www.molecularbio.cn/news/sanitation-verification-food-plants-points-frequency.html