


 Current
location:
Dairy processing has an unusual combination of risks: a liquid product that supports microbial growth, a process with many wet surfaces, and a pathogen — Listeria monocytogenes — that establishes in drains and equipment frames and then persists for years. A monitoring programme that samples only finished product measures the consequence, not the cause.
This article sets out a practical monitoring structure for a dairy plant: which points to sample, which organisms justify the cost, how frequently, and how a rapid method changes what the plant can do with the answer. It is written by the engineering team at HENG MEI Intelligent Manufacturing.
Three populations, not one
A dairy monitoring plan covers three distinct populations, and they answer different questions.
- Product — finished milk, yoghurt, cheese curd, powder. The question is release: does this lot meet specification.
- Food contact surfaces — tanks, filler nozzles, conveyor belts, moulds, slicing blades. The question is cleaning efficacy.
- Environment — drains, floor-wall junctions, equipment frames, condensation drip points, cooler floors. The question is whether a pathogen has established a niche.
Most recalls trace back to the third population. A plant that tests product diligently and swabs no drains is measuring its own output while ignoring where the organism lives.
Sampling points worth committing to
| Area | Points | Organism focus | Frequency |
|---|---|---|---|
| Raw milk reception | Tank outlet, filter, receiver | Total viable count, coliforms | Every delivery or daily composite |
| Processing line | Balance tank, pasteuriser outlet, filler heads | Total count, coliforms | Per shift on food contact surfaces |
| Filling and packing | Nozzles, capping heads, conveyor | Total count | Daily, after cleaning |
| Environmental | Drains, wall-floor junctions, cooler floors, door seals | Listeria | Weekly minimum, more in high-risk zones |
| Finished product | Retained samples per lot | Per specification | Per lot |
| Water and utilities | Process water, CIP final rinse | Coliforms, total count | Monthly and after any CIP change |
The list is a starting structure, not a prescription. The principle is that high-risk zones — areas where product is exposed after the final kill step — deserve more frequent environmental sampling than low-risk zones, and that the sampling map should be drawn on the plant layout rather than in a spreadsheet.
Why Listeria is the organism that shapes the programme
Listeria survives cold, forms biofilms and colonises wet infrastructure. Once established in a drain or a frame, cleaning does not remove it and the plant lives with a persistent source. That is why environmental sampling targets it specifically, and why several rapid systems that cover coliforms and total count do not offer Listeria at all.
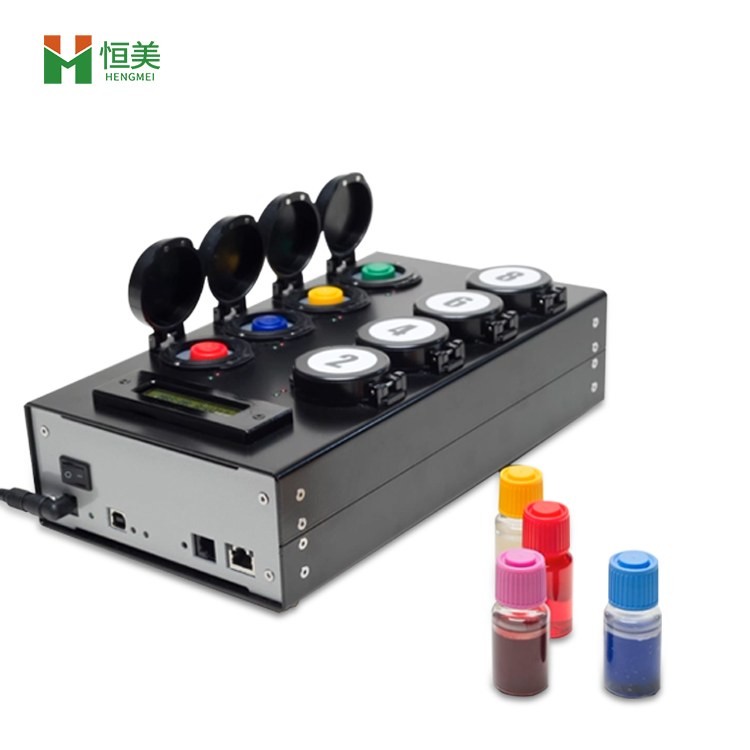
A reagent-bottle microbial system that includes Listeria lets a plant test environmental swabs and get a result within a shift, which changes the response from "investigate next week" to "clean and re-swab today". The operational value is not the assay's sensitivity; it is the time between sampling and action.
What rapid methods change — and what they do not
| Activity | Rapid CFU method | Reference method |
|---|---|---|
| Route monitoring | Appropriate | Unnecessary cost |
| Cleaning verification | Appropriate | Slower than the cleaning window |
| Release testing | Only where the specification allows it | Required where the standard names it |
| Positive confirmation | Not sufficient alone | Required |
| Regulatory reporting | Not accepted unless validated | Required |
The honest division is that rapid methods govern decisions inside the plant, and reference methods govern statements to the outside world. Plants that blur the line end up either over-testing or over-claiming.
Sample handling that preserves the answer
- Swabs and product samples go to the laboratory cold, not frozen. Freezing damages cells and depresses counts.
- Environmental swabs are taken before cleaning to find niches, and after cleaning to verify — two different questions, two different programmes.
- Sample area is fixed. A swab of an undefined area cannot be compared with the previous month's result.
- Each sample carries its point identity. A result without a location cannot be trended or acted on.
Turning results into maintenance
The most useful review is by point, not by date. A single environmental point that is positive repeatedly, even intermittently, indicates a design or maintenance defect: a cracked seal, a dead leg, a slope that holds water. Plants that review by point replace equipment; plants that review by date re-clean and hope.
For product results, trend rather than threshold. A total count that sits comfortably within specification but has doubled over three months is telling you something about cleaning chemistry or equipment condition that a pass/fail gate will never show.
Matching instruments to the programme
The reagent-bottle system described here, and the trade-offs in reagent cost versus labour, are covered in our microbial detection guide. For surface cleanliness verification between microbial tests, an ATP detector gives an immediate reading; its use and its limits are set out in the ATP monitoring guide.
To build a dairy monitoring plan around these instruments, tell our sales contact the products made, the high-risk zones on your line, the organisms your customers require, and the samples per week. Those four facts determine the test menu and the instrument capacity.
Contact: Arthur, Sales Contact, Arthur@hmdzkj.cn, +86 18353666151 (Tel / WhatsApp / WeChat).
Article address:https://www.molecularbio.cn/news/microbial-monitoring-dairy-production-sampling-points.html